In the world of IT, network management refers to the process of monitoring and troubleshooting a system. This article will discuss the components of network management and how they work. In addition, you’ll learn about SNMP and Telemetry and how they help your network run smoothly.
Components of network management
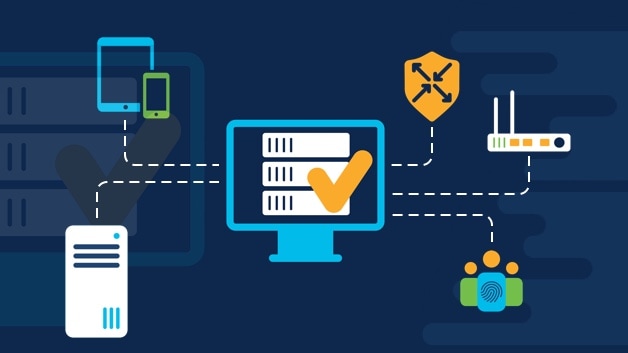
Network management architecture is built on three core components: managing entity, managed device, and management protocol. The managing entity may be an IT administrator, automation script, or network device, and the managed device is the network connectivity. Finally, the management protocol governs the relationship between the managing entity and managed device. The following sections discuss the components of network management. First, this article will examine the common types of network management. Also, we’ll discuss what is network management?.
The first component involves monitoring and logging network usage data. It’s crucial for cost management and identifies inefficiencies caused by errors and configuration issues. For large enterprises, this information is crucial in justifying the network’s relevance to the business operations. This is where network management comes in.
The next component involves fault management. This essentially consists in identifying and resolving any issues that arise. Often, a device is experiencing an error. Monitoring and troubleshooting are essential to minimizing downtime. If the problem is an unexpected change, troubleshooting will quickly identify it and fix it. A documented process should be created for each fault resolution. A network monitoring system should be able to identify problems before they disrupt traffic and lead to failure.
SNMP
SNMP is a protocol that helps networks monitor their health. It can be used by any machine to send queries to agents and has several valuable functions. Most of the SNMP commands are easy to understand. However, since 1988, network management has become complicated. Today’s networks contain numerous devices, and with the growth of the Internet of Things, the task will become more complex.
SNMP uses a UDP port to communicate with devices in the network. Devices that support SNMP are preconfigured to be able to receive and send monitoring data. Network servers maintain multiple MIB files that contain performance statistics, and these files are queried to get monitoring data. The protocol uses one or more of these files to communicate, and network monitoring tools use the information from these files to perform maintenance and troubleshoot operations.
The SNMP protocol relies on the concept of management information bases (MIB). MIBs are structured hierarchically and consist of a set of shared values and control values. A MIB can monitor any network device, including the Internet of Things, IP video cameras, vehicles, industrial equipment, medical equipment, and more. SNMP also has applications in network management, such as Dynamic Host Configuration Protocol (DHCP) and SNMPv3.
Telemetry
Telemetry in network management enables monitoring of lower-layer network metrics. For instance, telemetry systems can track packet-jitter measurements to determine when a network is affecting service. Additionally, telemetry can help identify and isolate network problems. By monitoring real-time flow activity, telemetry can help prevent network congestion, improve network performance, and save money on IT expenses. And the best part about telemetry: it is available for off-line use.
Network telemetry has several drawbacks. First, it is difficult to monitor network performance using SNMP alone. Second, SNMP is inflexible and cannot support high-speed monitoring of all network devices.
Telemetry solutions vary widely in size, from single-protocol flow exporters to advanced ASIC-based packet-level capture systems. Generally, the best telemetry solutions come with inline AI and machine learning capabilities. Therefore, IT managers should choose the right-sized solution to suit their needs. For instance, Netreo provides a full-stack monitoring solution that features intuitive flow record collection and insightful analysis of crucial application traffic flows. The platform also comes with an AIOps engine that delivers simple, actionable answers based on 20 years of historical data.


